The reporting view in Systam Pass gives you a quick overview of how content completions are going: how many were approved, how many rejected, and how long completion takes.
Where to find reporting
You'll find reporting in the top navigation bar of Systam Pass, under Reporting.
Summary cards
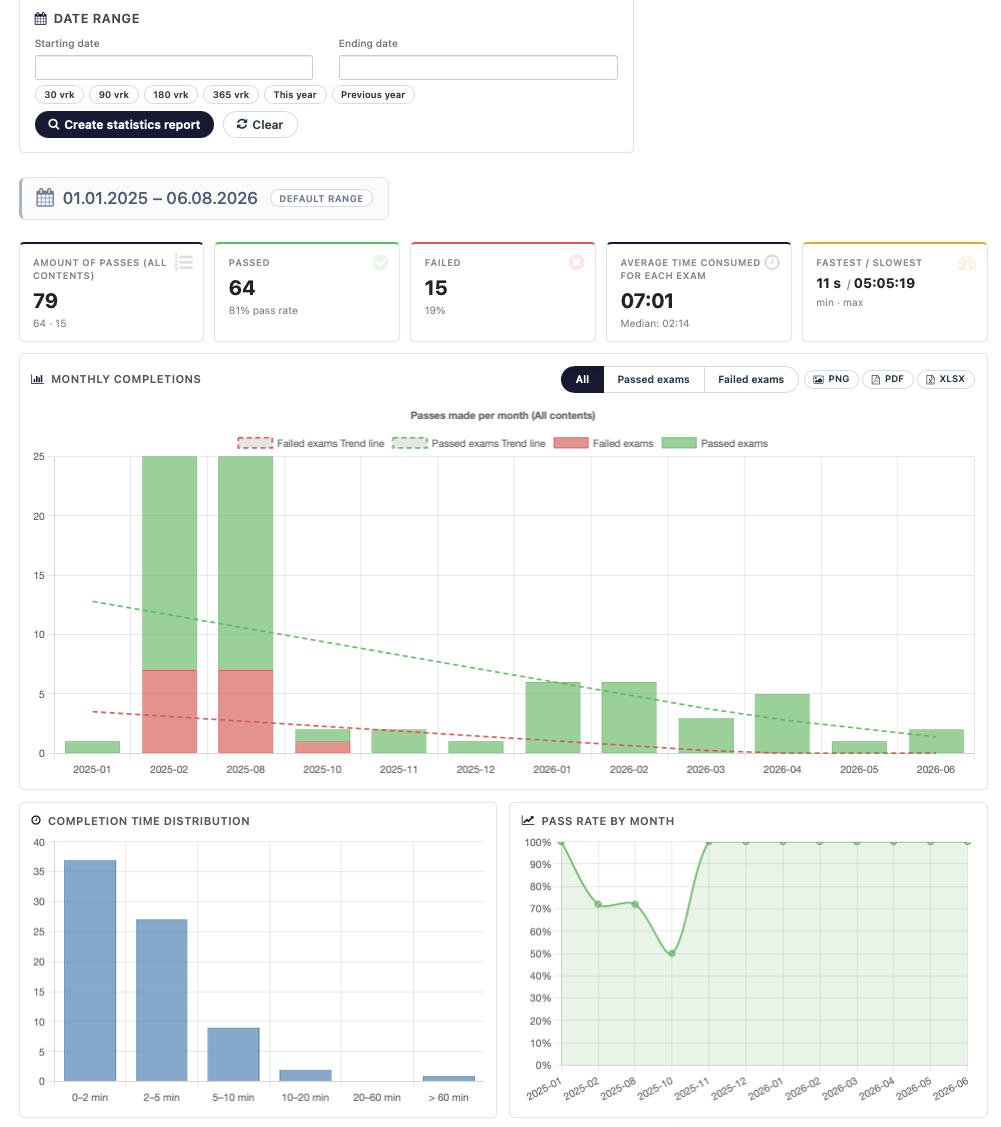
At the top of the view you'll see five cards:
- Total completions – the total number of completions across all content, with a breakdown of approved versus rejected.
- Approved – the number of approved completions and their share of the total (pass rate).
- Rejected – the number of rejected completions and their share of the total.
- Average time to complete – the average and median completion time.
- Fastest / slowest – the shortest and longest single completion time.
Monthly completions
A bar chart shows the number of completions per month. You can switch between three tabs: All, Approved completions and Rejected completions. The chart also includes a trend line showing the overall direction.
You can export the chart data as PNG, PDF or XLSX directly from the top right of the chart.
Completion time distribution
This chart shows how completions are distributed by duration: 0–2 min, 2–5 min, 5–10 min, 10–20 min, 20–60 min, and over 60 min. It's a quick way to see whether completions typically take a few minutes or longer.
Monthly pass rate
A line chart shows how the pass rate (the share of approved completions) has developed month by month, so you can spot if it's trending up or down.
That's it — these views keep you on top of how content completions are progressing.
Was this article helpful?
That’s Great!
Thank you for your feedback
Sorry! We couldn't be helpful
Thank you for your feedback
Feedback sent
We appreciate your effort and will try to fix the article